Financial Analysts Unveil Nine Moving Average Strategies for Traders
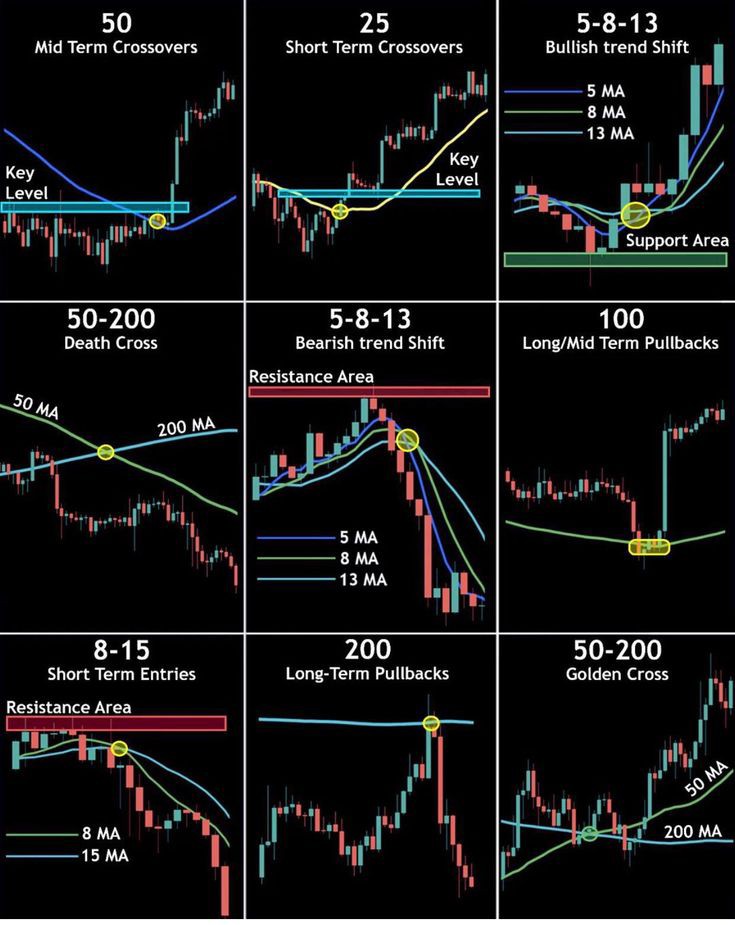
Financial analysts have released an extensive report highlighting nine moving average strategies designed to help traders identify trends, pinpoint entries, and anticipate resistance levels across global markets. The strategies address both short-term and mid-term horizons, with particular emphasis on technical indicators such as crossovers, trend shifts, and pullback opportunities. Central to the report are well-known signals like the 50-200 moving average “death cross” and “golden cross,” along with less conventional pairings, including 5-8-13 and 8-15 combinations.
Understanding Moving Averages in Trading
Moving averages remain one of the most widely used technical analysis tools in modern trading. By calculating the average price of an asset over a selected number of trading periods, they smooth market fluctuations to reveal underlying trends. Traders rely on moving averages to reduce noise, confirm price direction, and establish strategic entry or exit points.
Short-term averages, such as 5, 8, or 13 periods, react quickly to price changes, making them particularly useful for day traders and swing traders focused on detecting momentum shifts. Mid-term and longer averages, including 50 or 200 periods, are considered more reliable for institutional investors and portfolio managers due to their ability to filter out short-lived volatility.
The newly published chart provides traders with a structured framework to combine these averages across different time frames, offering actionable insight into both bullish and bearish market conditions.
The Golden Cross and Death Cross
Among the nine strategies detailed, the most recognizable are the “golden cross” and “death cross.”
The golden cross occurs when a shorter-term moving average, such as the 50-day, rises above a longer-term average like the 200-day. Historically, this signal has been interpreted as a shift toward sustained bullish momentum. Traders often view it as confirmation that institutional buyers are entering the market, creating strong upward pressure.
Conversely, the death cross is triggered when the 50-day moving average falls below the 200-day, signaling potential long-term bearish sentiment. Many investors recall the death cross that emerged ahead of the global financial crisis in 2008 and again during the early months of the 2020 pandemic. In both instances, the indicator preceded significant market downturns, reinforcing its reputation as a powerful warning signal.
Short-Term Crossover Strategies
Alongside these well-known indicators, analysts emphasized the utility of short-term moving averages for traders seeking quicker signals. Strategies using narrow time frames, such as 5-8-13 and 8-15 averages, provide a closer view of short-term price momentum.
The 5-8-13 strategy aligns multiple short averages in sequence. When the shorter averages cross above the longer ones, analysts identify potential entry opportunities. Reversals, meanwhile, serve as early warnings of fading momentum or looming corrections. The 8-15 strategy operates on a similar principle but with slightly broader time frames, giving traders signals that are marginally less reactive yet often more stable.
Such short-term strategies are particularly attractive in fast-moving markets like foreign exchange and cryptocurrency trading, where intraday shifts can translate into significant gains or losses within hours.
Mid-Term Averages and Dynamic Resistance
For traders looking beyond immediate price movements, mid-term moving averages, typically between 20 and 50 periods, were highlighted for their role in identifying dynamic support and resistance levels.
When an asset trades above its 50-day moving average, the line frequently acts as a level of support, cushioning pullbacks and indicating sustained positive momentum. Conversely, when prices dip below this mark, the 50-day average often becomes a resistance level, halting rebounds. Analysts noted that large-cap technology stocks frequently encounter such mid-term tests, with many rebounds in recent years clustering around these moving average supports.
Historical Context and Market Relevance
The use of moving averages dates back nearly a century, with early applications seen in commodity and equity trading during the 1920s and 1930s. Initially adopted by floor traders and chartists, moving averages gained widespread recognition in the latter half of the 20th century as computing power enabled faster calculations for mass-market adoption.
The golden cross, in particular, has been associated with several historic bull runs. For example, a widely cited signal in April 2009 marked the beginning of an extended recovery from the financial crisis, with major indexes surging in the following years. These past occurrences underscore why many traders monitor moving average strategies as part of their technical approach to risk management.
Economic Impact of Moving Average Strategies
While moving averages are purely technical indicators, their influence extends into broader market psychology. In heavily traded markets, when enough participants respond simultaneously to signals like the golden cross, self-fulfilling price moves can occur. This collective behavior reinforces the reliability of these strategies for chart-based decision-making.
Institutions often incorporate moving averages into algorithmic models, further amplifying their market impact. High-frequency trading systems may initiate buy or sell orders the moment crossover points are detected, accelerating price shifts in real-time.
For individual investors, accessible moving average strategies provide tactical advantages without requiring advanced computational models. With many online trading platforms now equipped with real-time charting tools, even retail traders have the ability to implement crossover or pullback strategies.
Comparisons Across Global Markets
Different regions apply moving average strategies uniquely, influenced by market volatility, liquidity, and investor culture.
In U.S. equities, widely followed signals like the 50-200 golden cross often spark extensive media coverage, contributing to broad market swings. For example, golden cross formations on the S&P 500 frequently coincide with heightened retail interest and rising trading volumes.
In European markets, where trading dynamics tend to be more conservative and institutional-driven, mid-term averages such as 50-day signals often carry greater weight. These markets have historically exhibited a slower response to short-term crossovers, lending more emphasis to long-term technical confirmation.
By contrast, Asian markets, particularly in fast-paced environments like Hong Kong and Tokyo, display greater responsiveness to short-term moving averages. Analysts attribute this to higher retail participation, as individual investors frequently dominate trading volumes. Similarly, the use of 5-8-13 strategies has increased dramatically in cryptocurrency trading hubs across Singapore and Seoul, where day traders seek to capitalize on swift intraday movements.
Pullback Strategies and Market Volatility
One of the key lessons highlighted in the new report is the use of moving averages as pullback indicators. When assets retreat toward a rising moving average, traders often interpret the movement as a healthy pause within a larger trend, allowing new entry opportunities at reduced prices.
This approach can be particularly valuable during periods of heightened volatility. Pullbacks to the 20-day or 50-day averages are frequently observed in technology, energy, and growth sectors, where price surges often exceed long-term equilibrium levels. Traders use these short corrections as chances to accumulate positions before subsequent rallies.
Risk Management and Limitations
While the outlined strategies offer valuable guidance, analysts caution that moving averages are not infallible. False signals, known as “whipsaws,” can mislead traders when crossovers quickly reverse. Such events are more common in sideways markets where price action lacks a strong directional trend.
To mitigate risks, many traders combine moving averages with additional indicators such as relative strength index (RSI), Bollinger Bands, or volume trends. This layered approach helps confirm signals and reduce the likelihood of overtrading on false crossovers.
Market Outlook
As global markets continue to navigate heightened uncertainty driven by inflation pressures, shifting energy prices, and geopolitical risks, the demand for technical clarity is growing. Moving average strategies remain a central tool, not only for experienced analysts but also for the broader community of retail traders seeking structure amid turbulence.
The release of the nine-strategy framework underscores the enduring relevance of moving averages, offering practical guidance for traders navigating markets that increasingly blend long-term investment with short-term speculation. Whether through golden crosses that hint at extended bullish runs or short-term pullbacks suggesting tactical opportunities, these strategies continue to shape the way global markets interpret price action and investor sentiment.